Using a Feature Matrix to analyze the market and find your niche
This article shows you how a feature matrix can be a valuable analysis tool for software entrepreneurs. Most people first encounter feature matrices as tables on those manipulative “Why our product is better than Competitor X” pages, where they only include rows that make the featured product look good and the competitor bad - an exercise in selective truth-telling. You might also recognize them from pages showing which features are available on different tiers of a subscription - Hrvey’s own plan comparison is displayed this way too, as is Slack’s:
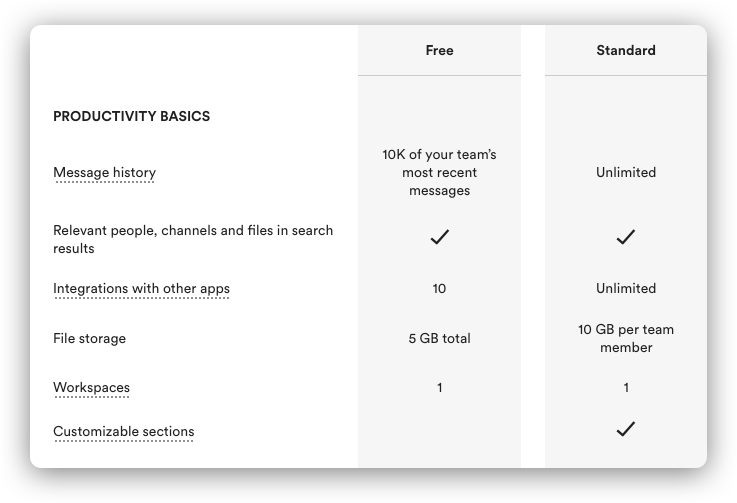 A part of Slack’s feature matrix
As you can see, a feature matrix is simply a table with a feature in each row and a competing offer (or subscription tier) in each column, and then each cell has either a checkmark - to indicate that the product in that column has that row’s feature - or a numeric value or description to indicate how much (e.g. 10 users, Unlimited, 5 GB).
It turns out that as a software entrepreneur, if you make a feature matrix for your own use, then it can be a powerful tool for getting an overview of and understanding the competing offerings that make up the market you want to compete in. Used this way, it allows you to analyze that market, group related features together, segment users and competitors, and find your niche.
Template
You can do this in any tool that works with tables, such as Excel, Google Sheets, Airtable or Notion - for this example I’ll use Google Sheets. If you’d like to follow along, I’ve created a Google Sheets template that you can make a copy of by clicking here, so you can fill it out yourself. Here’s what it looks like:
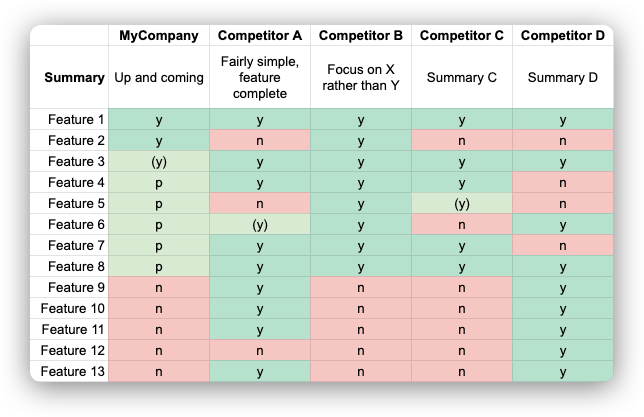 Competitor feature matrix template in Google Sheets (link)
I’m using conditional formatting to change the background color of the cells based on their content so it’s easier to get an overview at a glance:
y(yes, has the feature) is green(y)(sorta has the feature) is light greenp(planned) is also light greenn(no, does not have the feature) is red.
I’ve also added a row at the top to write a summary of the analysis for each company - you can add more rows like this for things like pricing and (your estimate of) their target demographic if you want.
How-to
To fill this out, first off, you’ll need to identify your competitors if you haven’t already. The way to do that should be to go through the same steps that your potential customers would go through to discover your product - i.e. for a SaaS like Hrvey the channels would be Google search, comparison sites (e.g. Capterra, G2 and the like) and integration marketplaces for platforms that we integrate with like G Suite and Slack. When you’ve identified your competitors, add them as a name in a column at the top of the table.
Then you need to dig into features for each of them - most SaaS’es come with 30 day trials these days, so use that to actually spend some hours digging into the feature set of each of these - see how quickly you can become a power user. Whenever you come across a new feature, add another row to the table. As a sidenote, I’d suggest taking screenshots along the way, so you can later remember how something worked even after your trial ends. This is valuable research for product management, and lets you to get inspired by the best implementations out there.
Now, once you’ve filled out the table, start looking for patterns in which features are implemented by companies. If there are clusters of related or similar features that tend to be implemented together or not at all, then rearrange rows so they are next to each other (you can move rows up or down in Google Sheets by click-dragging the row number on the left). Likewise, if you find clusters of companies that have similar feature sets, you can rearrange the columns to group them.
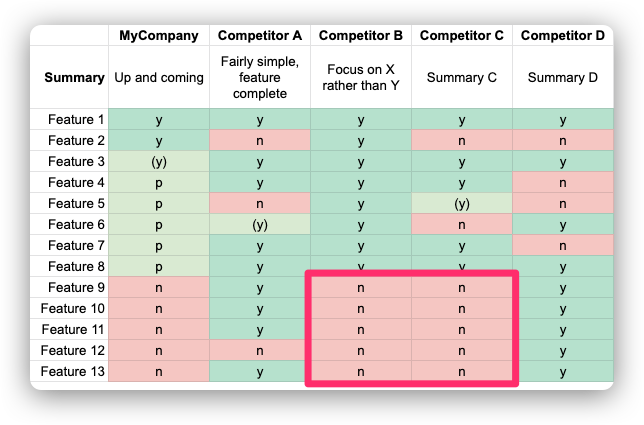 A cluster of related features
Analysis
Once you’ve done this, you can start using this information to understand and segment the market. If you can find clusters of related features like the above, then that can tell you a lot about the market. For example when starting Hrvey, we wanted to make a tool for leave tracking, but we also identified a cluster of features that some competitors had and others didn’t. These were features relating to other HR tasks - applicant tracking, performance reviews and the like. And we realized that we could roughly divide the offerings into two groups - the full HR suites with all the bells and whistles, and the more focused tools that focused just on leave tracking.
We came up with the hypothesis that a feature like leave tracking (which is used by all the employees of a company) would tend to drown in the user interface of a service with all the other features (which are mostly just used by a handful of HR people) so there’d be a market for tools with limited functionality, but with a focus on ease-of-use. And the matrix indicated that other companies believed so too - and it also gave us a baseline of which features were considered “core” for that segment.
So we started focusing on companies offering that limited feature set, and rated them based on their UX. From this perspective, suddenly the field of 15 or so companies that we were comparing with left us with only 1 or 2 direct competitors with what we would consider good UX. At that point our question transformed into “How can we match or outdo them on UX?” and “What features can we add that would set as apart from them?”
Your niche
With this in mind we started focusing more on optimizing the integrations we have with G Suite and Slack and using the overview we had gotten of the UX of our competitors to match or improve on the best implementations we’d seen. We’d found the niche we wanted to target, and knew who our closest competitors were.
When you perform this analysis, also think about whether you can sell a similar product to a different demographic. For example, it might be possible to sell a “booking and appointment reminder” system to hairdressers even though someone else is dominating the market for dentists - and it might mainly entail changing how you communicate about the product. Similarly, it’s quite possible to create an almost identical product but sell it as a low-touch, low-cost alternative for small- and medium sized businesses even while a competitor is doing high-touch sales to enterprise.
Your biggest competitor isn’t necessarily the biggest player in your space - it’s the player that is most successfully targeting the same demographic as you, using a similar feature set. If nobody else is, then you’ve found the niche equivalent of a “blue ocean”.
For Hrvey, our initial focus on integrations with platforms like G Suite and Slack means our demographic is skewed toward software companies and companies that are “techy” enough to understand and appreciate such integrations. But realizing this also means we have an avenue of growth in the future, by adding features or changing our communication to hit other or broader demographics - and the feature matrix will help us understand if anyone else is directly competing for any new niche that we might target.
Closing thoughts
Finally, a word of warning: There’s a reason it is generally advised not to focus too heavily on your competitors and instead listen to what the market and your customers are telling you - this is generally sound advice, since the other approach will always leave you one step behind. So bear in mind that a feature matrix looks at the competition - it won’t tell you if there’s a set of features that the market wants but nobody is providing. However, also realize that your competitors are listening to their customers too - so used correctly, the patterns you find in a feature matrix can be your way of understanding what the market has been telling your competitors, so you can enter the market with a leg up.
Hrvey is a modern tool for managing vacation and leave - learn more here!